Teach the 9x Nine Times Tables

This podcast video is from my Free Math Worksheets series, which you can access here.

If the video does not display, watch on YouTube.

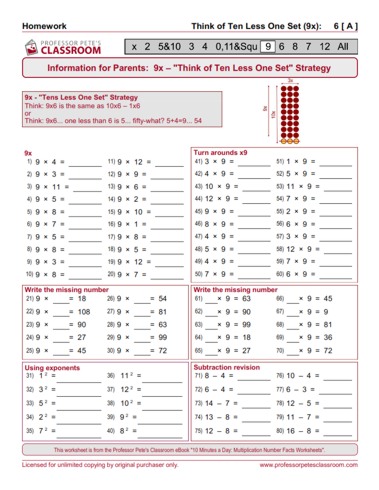
Download Free Worksheets: 9x Tables

Multiplying by 9 raises some really simple and interesting patterns, which you can use to help children to learn this set of number facts or times tables.

Teaching the 9x Nine Times Tables

9x Tables: Start With 10

As explained in the video, if you start with the equivalent multiple of 10, you can then compensate to quickly find the 9x answer. For example, think about 8×9:

  • 8 x 9 = ?
  • 8 x 10 = 80
  • Subtract 8 ones (one for each set of 10): 80 – 8 = 72
  • 8 x 9 = 72

9x Tables: Sum of Digits Equals 9

Look at the multiples of 9 up to 90, and check out the sum of the tens digit and the ones digit in each multiple:

  • 09  :  0 + 9 = 9
  • 18  :  1 + 8 = 9
  • 27  :  2 + 7 = 9
  • 36  :  3 + 6 = 9
  • 45  :  4 + 5 = 9
  • 54  :  5 + 4 = 9
  • 63  :  6 + 3 = 9
  • 72  :  7 + 2 = 9
  • 81  :  8 + 1 = 9
  • 90  :  9 + 0 = 9

Students can use a two-step process which takes advantage of the above pattern:

  • 6 x 9 = ?
  • There must be 5 tens (because we know it is a bit less than 60)
  • So, 6 x 9 = 5?
  • If the digits in the answer add up to 9, what is the other digit; ie, 5 + ? = 9. The other digit must be ‘4’
  • 6 x 9 = 54

9x Tables: Finger Trick

Put both hands up in front of you, palms facing away. Imagine that each finger is numbered, from left to right, from 1 to 10.

To find a multiple of 9:

  • 3 x 9 = ?
  • Hold up your hands, thumbs together
  • Put down the finger that corresponds to the number multiplying the 9: the third finger
  • Count the fingers to the left of the finger that is down: 2 – this is the number of tens
  • Count the fingers to the right of the finger that is down: 7 – this is the number of ones
  • 3 x 9 = 27

Are Wind Farms The Solution? Do the Math!

It’s Agreed: Teachers Should Teach Environmental Responsibility

Teachers around the world are expected to teacher their students to be responsible citizens, to reduce their impact on the environment and to support sustainability. For one example, see the new Australian Curriculum’s Cross-Curriculum Priority: Sustainability.

Great, good stuff. In fact, it would be difficult to imagine a teacher anywhere who did not believe in protecting the environment for future generations, and teaching today’s students to be responsible adults in the future.

But does mean that we should agree to promote every green cause or environmental suggestion, “just because”. Some ideas are really dumb, including those with a green label applied. How can we tell them apart? Do we just let others decide for us, or do we think for ourselves? I reckon we should use math to check out the facts – and teach our students to do the same.

Will Wind Farms Fix the Energy Crisis?

A lot of environmental activists and politicians are currently promoting wind energy as the solution to global warming and the world’s reliance on dirty fossil-fuel-generated energy. Are they correct?

The answers aren’t all in yet, but it is important to do some basic research, rather than just believing the promoters. There are some great sites out there with lots of information on outputs, days of output, daily averages, hourly averages, etc.,  which give a much better idea of what is actually happening.

Will wind energy on its own replace other forms of electricity generation?

Other considerations for developing an informed basis for developing an opinion could be factors that are unique to wind farming. Such as:

This is the final podcast episode that was recorded on our trip in Europe. Future episodes will be videoed in the classroom.

Podcast Location:

South Lanarkshire wind farm. You’ll notice that the Google maps photo doesn’t show the wind turbines; the photo must have been taken before they were constructed. If you check the Street View, you will see them.
View Lochhead (Wind) Farm, South Lanarkshire in a larger map

So Where’s the Math?

Teaching about environmental issues is a great opportunity to promote socially responsible outcomes in your students’ lives. It is also a wonderful opportunity to put those mathematics skills to really practical use. Environmental projects always produce controversy, because they always involve costs to someone or other, along with the benefits. In order to reach sensible, informed conclusions, we should return to the data, and ask “What are the facts?”. Your students are ready to answer questions of concern to them, that are matched to their level of maturity. Use math to help them decide!

With your class you could do some activities such as actually planning a family’s daily needs based on the output from turbines on different days. How is industry affected? What is the daily consumption, or even the hourly consumption of power of a city? Are its needs steady or fluctuating? How does this affect the power industry? With these ideas it would be possible to follow through on an idea and make a great math project where the application of math is almost limitless.

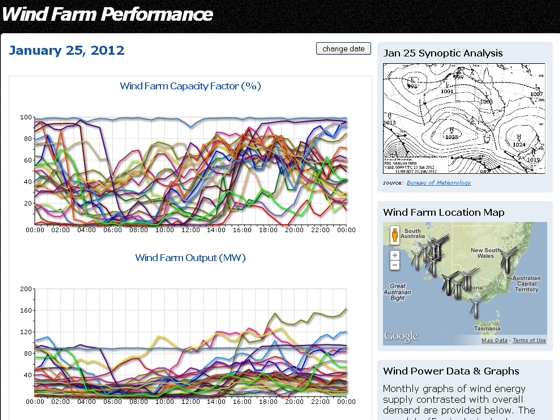
The Wind Farm Performance site has lots of real-time stats and graphs on Wind Farms:

What do you teach in environmental studies that could use some reality in the form of data? I’d love to hear your ideas – please leave a comment below.

Related Videos

Explanation of the components of a wind turbine:

Turning the Weather Into Power (article + Flash animation) – click image for link:

Danish wind turbine fails in storm:

Wind energy in west Texas, Wind Turbines:

Wind Farms in the Media This Week:

Photo Credit

Children Recycling: © iStockphoto.com/Randy Plett

Math and International Travel

If you’ve followed previous episodes of this blog, you will know that earlier this year in the northern spring my wife and I were blessed to travel in Europe.

Traveling between countries got me thinking about the types of mathematics you do when traveling. In addition to the usual math of budgeting, cooking, scheduling events, and so on, when you travel into a foreign country you have the extra challenges of conversions.

There are two main types of conversion an international traveler will likely have to do:

  • Converting currency from one country’s currency to another’s
  • Depending on the two countries, converting units of measurement between metric (SI) units and British/Imperial/American Conventional units

The video was shot in a studio in front of a ‘green screen’, to allow me to overlay videos. The background shows shots I took on the ferry between the UK and France on our trip, to set the scene for traveling between countries. I thought of doing the video live on the ferry, but it was too windy and noisy.

Converting Currency

Unless money was truly unlimited (certainly not the case for me), when buying food, gasoline and souvenirs a traveler will want to work out just how much he or she is paying for an item, in a familiar unit of currency. This is done using a currency conversion factor,  a number which changes continually. As explained in the video, there will be a pair of currency conversion factors for any two currencies, which are numerical inverses of each other. For example, the pair of conversion factors for Australian dollars (AUD) and British Pounds (GBP) at the time of writing is:

  • 1.52875
  • 0.65413

[source: XE.com on October 16, 2011]

This means that £1 British, the more valuable of the two currencies, is equivalent to A$1.52875; conversely, A$1 is equal to £0.65413.

The neat thing is that one can use either of these factors to derive the other by inverting it, and one factor can be used to convert the two currencies in either direction. Thus:

  • 1 ÷ 1.52875 = 0.65413
  • 1 ÷ 0.65413 = 1.52875

Using these data in everyday transactions, when traveling in the UK I could convert prices to Aussie dollars pretty easily and accurately by adding a half. So a burger for £4.99 would be worth around $7.50 in our money. Going the other way, I could take around two thirds of an Australian price to get the rough equivalent in British currency.

Of course, a calculator will do this more easily, and a travel calculator is designed to simply convert in either direction by the touch of a couple of buttons.

Converting Units of Measurement

Depending on where you travel, you may be faced with different units of measurement from those you are familiar with. Europe, Australia and much of the rest of the world use Metric units, whereas the US and the UK are largely still using British Imperial units. Traveling on UK roads I changed the settings on my GPS device to use miles rather than kilometers, but in France I changed back to kilometers. That way road signs indicating how far a town was would match what the GPS indicated.
Manual or calculator conversions of measurement units are done in much the same way as converting between currencies, and again each type of conversion will have a pair of inverted factors. One example:

  • 1 inch = 25.44 mm (millimeters)
  • 1 mm = 0.3931 inch
  • 1 ÷ 25.44 = 0.3931
  • 1 ÷ 0.3931 = 25.44

International travel is not the only context for conversions like these. Other uses for these processes are international trade, which might be the subject of investigation in a geography or economics class; and international commerce, such as purchasing goods over the internet. Given the growth in trade and the opening up of secure, simple ways to buy goods on the internet, these are relevant topics for students and a straight-forward context for multiplication and division, including discussion of the best method for these calculations.
Where is Zero on the Earth?

This is another in the series of podcasts from our trip in Europe.

Knowing exactly where you are on the earth’s surface is pretty important for most of us, and absolutely vital for airline pilots, surveyors, engineers and cartographers. Early study of location was difficult and inaccurate, hampered by lack of technology we now take for granted, and also by faulty understandings of the earth’s shape and location and movement in space.

I have long wanted to visit Greenwich, in London, to see the place which was designated as one of the ‘starting place’ for measurements on the earth’s surface, and also the reference point for time zones.

Google Map

This map shows the location of the video, and the Prime Meridian:

View Royal Observatory, Greenwich, London, UK in a larger map

Royal Observatory, Greenwich

In 1884, Greenwich was chosen as the place for the ‘Prime Meridian’, the official dividing line between the eastern and western hemispheres, the line of 0° longitude. Of course, the Equator is the equivalent line of 0° latitude, dividing the northern and southern hemispheres.

The Royal Observatory at Greenwich website includes this interesting snippet about the history of the Prime Meridian:

The Greenwich Meridian was chosen as the Prime Meridian of the World in 1884. Forty-one delegates from 25 nations met in Washington DC for the International Meridian Conference. By the end of the conference, Greenwich had won the prize of Longitude 0º by a vote of 22 to 1 against (San Domingo), with 2 abstentions (France and Brazil).

The day we visited we had to drive to Scotland and didn’t have time to go into the observatory. If you have time when you visit London, I recommend a visit to this iconic location on our planet.

Math in the Cemetery

How can you use a field trip to a cemetery to teach mathematics?

I visited Richmond Park in London with my brother, and while there visited the East Sheen Cemetery to film a podcast.

What can  you learn in a cemetery? At first glance, this may sound like a strange or even morbid suggestion. However, provided you don’t have an issue with this (and neither do the parents of your students), there is a lot to be learned from the information a cemetery offers. In fact, the headstones or other locations where details of those who have passed are recorded form a statistical database of the community, potentially a very rich and fascinating record of the history of people who have lived in the area, and the events that have affected their lives.

Google Map

This map shows the location of the video. Zoom out to see its location in relation to the London city centre:

View East Sheen Cemetery in a larger map

The cemetery I visited is in London, which has had a number of critical events in its history that might be reflected in the records at a cemetery, such as:

  • The Great Plague (1665 to 1666; killed 60,000 people)
  • The Great Fire of London (1666; killed 16)
  • World War I (1914-1918)
  • World War II & the Blitz (1939-1945; 30,000 killed)
  • Great Smog of London (1952; 4,000 died)

[Wikipedia: History of London]

Your local cemetery will, of course, reflect the history of your local area. This opens up lots of opportunities for studies in social studies, history, civic studies, geography, and math. In fact, mathematics can be put to good use to serve studies in other disciplines, by providing tools and methods to collate and analyse the data that is collected.

As a starting point, you could ask students to record the following data from grave records for later study in the classroom:

  • date of birth
  • date of death
  • gender
  • occupation
  • cause of death, if stated
  • relationship to others buried nearby
  • other interesting information

Footnote

By the way, this week I have made a few changes to the site, including removing a lot of fiddly looking links and graphics from the side menu and changing the colour scheme.
The biggest change, however, is that I have canned the audio podcast. The videos will continue, but the number of downloads of the audio was much lower, and so I’ve decided to simplify my life a bit and just produce one version of the podcast. The audio track is available from this page, if you’d like it, but it’s not part of the podcast feed for subscribers. Please let me know what you think!

Teaching Slope in the Mountains of Switzerland

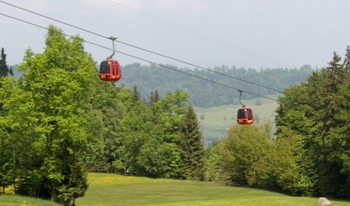
Switzerland is known for its beautiful mountains and chocolate-box scenery, summer or winter. My wife and I were blessed to visit there this last spring, so I took the opportunity to video another podcast episode. We took a cable car up a smallish mountain near Lucerne; actually probably just a hill by Swiss standards, then walked down. We’d done this before on a higher mountains when we were younger and fitter, and ended up unable to walk the next day. So this time we were a bit wary of taking on too much.

So, what about the math in this setting? The cable car and the incredible mountains, and the road tunnels that go through them all got me thinking. The swiss have developed an impressive network of roads that enable a driver to travel all over the country, in spite of the mountains that threaten to prevent travel due to their sheer size and their steep slopes.

To cater for this steep topology, Swiss engineers have put in place cable cars, modified railways, tunnels and myriad other installations to respond to the terrain. Sloped paths, steps, zig-zag roads and a thousand other examples allow life to happen in among the mountains.

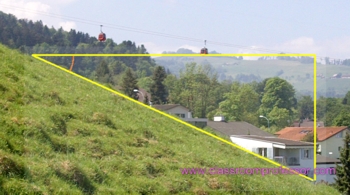
Here is the video. It includes a montage of varied shots of the cable car we rode on, and at the end there is an overlay of the angle of the slope itself (my apologies that the overlay doesn’t fit the slope very well – it’s an artifact of the video editor I use, due to changing from 16:9 to 4:3 aspect ratio, if you are familiar with video editing you’ll understand).

If you are interested, here is an interactive Google Earth view of the location where I shot the video:

So, back to the math. In geometry or space lessons, we teach about slope and angle, which can often be rather a dry topic without a real-life application. The slope of a ramp, a steep road, the cable for a cable car, are all such applications. Using a few simple props, your students can measure slopes and apply mathematics to analyse them and measure their stats. This can then be linked to:

  • slope expressed as a ratio (eg, 1:8 – I remember these from when I was a child)
  • slope as a percentage (eg, 12% – the more modern style)
  • the angle of the slope
  • the tangent of the angle, or the sine or cosine

Cross-curricular links could then be made to topics such as:

  • mechanical advantage in a certain slope (how much easier is it to move up one slope compared to one with a different angle?)
  • technology and engineering of building ramps, tunnels, cable systems, and so on
  • environmental aspects of sloped land, such as erosion
  • ‘optimal slope’ for certain purposes, such as driving a vehicle, mowing a sloped paddock, walking, etc.
  • aesthetic aspects of hilly or mountainous country, when compared to flat land (How does the scenery make you feel? Why do people like to take vacations in the mountains?)

What do you teach about mountains in your curriculum? Could you incorporate slope in applied lessons with your students? Please leave a comment below – I’d love to hear your thoughts.

Till next week…