Why do western nations like the US, Australian and the UK struggle to compete on the international stage when it comes to school mathematics?
A couple of days ago, the Programme for International Student Achievement (PISA) results from OECD countries were released. I encourage you to go over and have a look.
If you’d rather read someone else’s summary of what is shown in the results, try one of these articles. It’s fascinating to see the different interpretations put on the results in just these few media outlets:
The big majority of visitors to this site are in the following five countries. Check out the position of each one on the mathematics test, out of 65 in the PISA rankings:
USA – 36th
Australia – 19th
UK – 26th
New Zealand – 22nd
Canada – 13th
What can educators in the West do about the relatively poor showing of their students in mathematics?
Rain gauges measure rainfall by collecting a small sample and measuring how deep the water is. The trouble is, we are interested in very small units – in the metric system, rainfall is measured in millimetres/millimeters. How can you accurately measure such small amounts?
How can we use everyday examples to teach measurement?
Watch the video: I explain how a rain gauge amplifies the depth of water collected to make it easier to measure.
Do you know of young children who are apprehensive about the new grade they will face after the summer break?
Check out how some Minnesota teachers have used a custom website Almost a Third Grader to address this issue.The results are, I think, quite brilliant. No wonder the project has been picked up by local media and even the National Council of Teachers of Mathematics’ daily SmartBrief.
Some features I really like:
A new theme/topic every couple of days over the summer
Free access without having to sign in
Engaging teaching videos made by teachers
Web links to other sites
Age-appropriate content
“Poll of the day”
With all the free tools available today, I doubt the teachers behind this project had to pay more than a few dollars for this entire site. The only real cost was their time, and the payoffs should be great, not just this summer but for years to come.
What could you do to help your students using free web tools like this?
The trouble with most so-called “educational software” for teaching math is that is was designed by a programmer or a business owner, not an educator. As a result, it was designed to connect questions with answers really fast, in the mistaken belief that if you could just automate the testing of students on matching question and answer, they would learn faster and better.
Yeah, so what?
Trouble is, most of the math adults use in real problem solving involves figuring out what math is needed, finding the best tools to use, then applying them and evaluating the result. If the chosen tools do not produce a solution, then alternative pathways are tried, until the solution is reached.
Very little actual use of mathematics involves memorizing and single fact in response to a simple question, which is exactly what is targeted by most math software.
A New Pedagogy: Provide Tools to Support Thinking
Let me introduce a new set of interactive, cross-platform teaching and learning tools, which we call Professor Pete’s Gadgets.
Professor Pete’s Gadgets are designed to interactively support students’ development of mathematical thinking, by presenting them with symbols, pictures and words which they can manipulate to understand how they relate to each other. It is a fantastic teaching tool that, combined with well sequenced lessons and worksheets, allow students to understand the math concept.
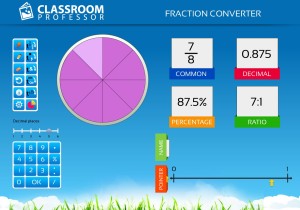
For example, they can see how common fractions, percentages, decimal fractions and ratios relate to each other, what they look like in a pictorial form and where they sit on a number line between 0 and 1:
If you remember learning times tables by reciting them over and over and over, you are probably skeptical that students could actually enjoy the exercise.
But if you provide students the strategies they need to make sense of the numbers, they do in fact enjoy it. And what really motivates them is to be able to improve on their times day by day.
Developing Number Fluency worksheets eBook series
Aligned to curriculum documents for students in US, UK and Australia
Strategy-based approach so students develop understanding as they memorize facts
Daily worksheets, including fortnightly assessment sheets
Comprehensive system to teach every fact for every operation, in 10 minutes a day
Integrated homework sheets so parents can support classroom teaching
Duplication license allows for unlimited copying by the original purchaser: no more to pay
30-day money-back guarantee, no questions asked
Year-level bundles for enough worksheets for entire year cost less than US$70
Sample worksheets to try at home or in class:
The “Developing Number Fluency” eBooks Series
Click the link to download a sample from the series:
We were at the BETT Show in the ExCel Centre in London!
I am pleased to announce that yesterday (January 30th) we launched our interactive, cross-platform teaching and learning tools, Classroom Professor Gadgets.
Professor Pete’s Gadgets are designed to interactively support students’ development of mathematical thinking, by presenting them with symbols, pictures and words which they can manipulate to understand how they relate to each other.
For example, they can see how common fractions, percentages, decimal fractions and ratios relate to each other, what they look like in a pictorial form and where they sit on a number line between 0 and 1:
Professor Pete’s Gadgets: Fraction Converter
If you are able to get to BETT, come and find us at stand C355 and say “G’day!” I’ll have a free gift to give you to thank you for your support.
Having taught many classes of primary/elementary students, I have taught my fair share of lessons on the Order of Operations. To me, the rules for applying operations in the correct order are not that difficult:
Process whatever is in brackets first (applying later rules if necessary)
Apply “other” operations such as indices/powers or square roots.
Apply multiplication and division, in order as they appear from left to right.
Apply addition and subtraction, in order as they appear from left to right.
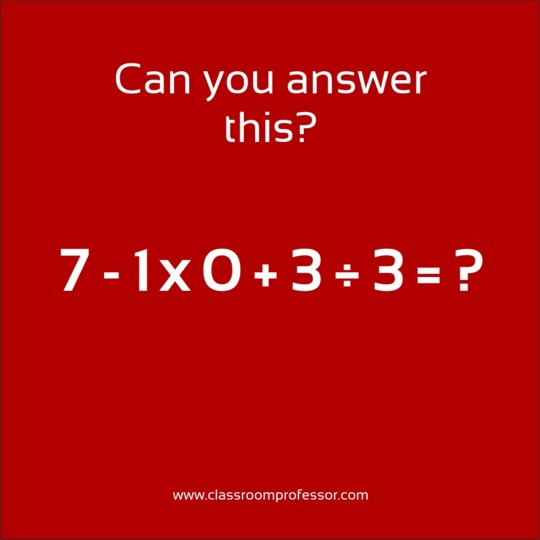
The reason for having these rules, of course, is so that we can all agree on the value equal to an expression with multiple operations. Otherwise, we would have ambiguous situations, which would be highly inconvenient, to say the least. For example, how should we evaluate the following:
2 + 5 x 7 = ___
If we work in order from left to right, we get 49: 2 + 5 = 7; 7 x 7 = 49
If we apply multiplication first, then addition, we get 37: 5 x7 = 35; 2 + 35 = 37. This is the correct answer, but only because we collectively agree that we should carry out multiplication before addition.
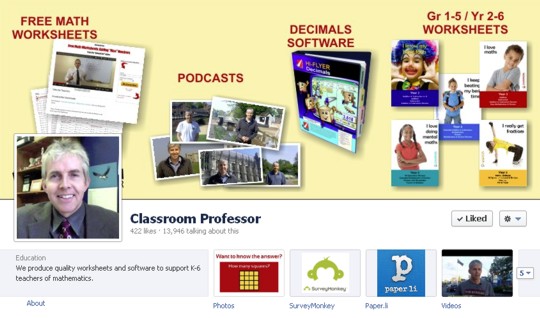
My intention with the Facebook post was to generate interest, attract people to “Like” the page, start conversations, and so on. My Facebook page at that time had around 150 people who had “liked” it, and I was used to seeing around 100 interactions a day on the page. I was unprepared for what happened in the following 2 weeks:
over 70,000 people in all saw the post
over 6000 people left comments
more than 140 shared it with their followers on Facebook
over 400 liked the post
more than 15,000 interacted with the post
Apparently, this question caught the interest of a lot of people on Facebook, and many felt the need to respond (which was the whole idea, of course). I guess almost all adults learned to answer questions like this at school, and over 6000 who saw it were confident enough in their abilities to answer it in public. I presume they believed they were correct with their answer, and in fact several backed up their numerical response with comments emphasizing that they believed with great confidence that they were correct:
“8 use BODMAS”
“… and in arithmetic you apply the multipliers and dividers first, then the additions/subtractions afterwards, so the answer is 8”
“7-(1×0) + (3/3) = 7-0+1 = 8”
“YOU GUYS ARE SO DUMB YOU HAVE TO USE FREAKIN ORDER OF OPERATIONS SO ITS 8, im seventh grader and i got that right and adults cant WOW”
Most amusingly (or worryingly), even those who were incorrect often tried to justify their responses:
“it’s 4 you idiots”
“It is 6 if you apply principle of BoDMAS”
“6 do the BODMAS rule! Brackets first then in order, pOwers, Division, Multiplication, Addition, Subtraction!”
“1 because 7-1=6×0=0+3=3/3=1 SIMPLES”
“PEMDAS 1*0= 0 / 3=0 +3=3-7= -4”
“Think you all need to go back to school. Anything X 0 is 0…!!!!!!!”
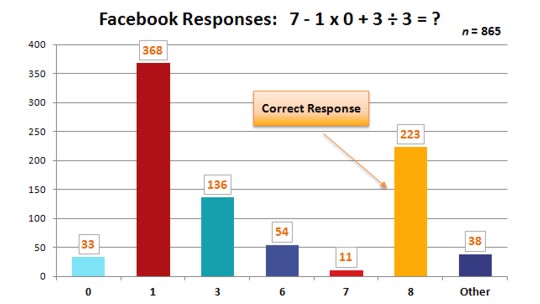
Seeing the huge number of responses I thought it would be interesting to analyze them to see just how good today’s Facebook users are at primary / elementary level arithmetic. The results were, to say the least, disappointing:
All up, out of the sample of 865 responses which were analyzed, just 25.8% of responses were correct. Of the three-quarters of incorrect responses:
43% of respondents apparently applied the operations strictly in order from left to right: 7 – 1 = 6; 6 x 0 = 0; 0 + 3 = 3; 3 ÷ 3 = 1
16% of responses were 3. This may have been the result of ignoring the “multiplying by 0”, getting (6 + 3) ÷ 3 = 3
6% of answers were 6, perhaps because the respondent made a mistake in calculating 3 ÷ 3
4% of respondents gave the answer 0. A number of people explained that “anything multiplied by zero equals zero”, evidently applying that to the entire expression
I have some ideas about why this little experiment found just 26% of Facebook users who saw and responded to the question could answer it correctly. What do you think? Are we teaching the order of operations badly? Should we even bother to teach it, since it seems not to be successful?
This week, my wife and I are in South Korea to visit family.
I have noticed when visiting museums that I am often able to use math to make sense of information that is presented in Korean, a language I don’t speak.
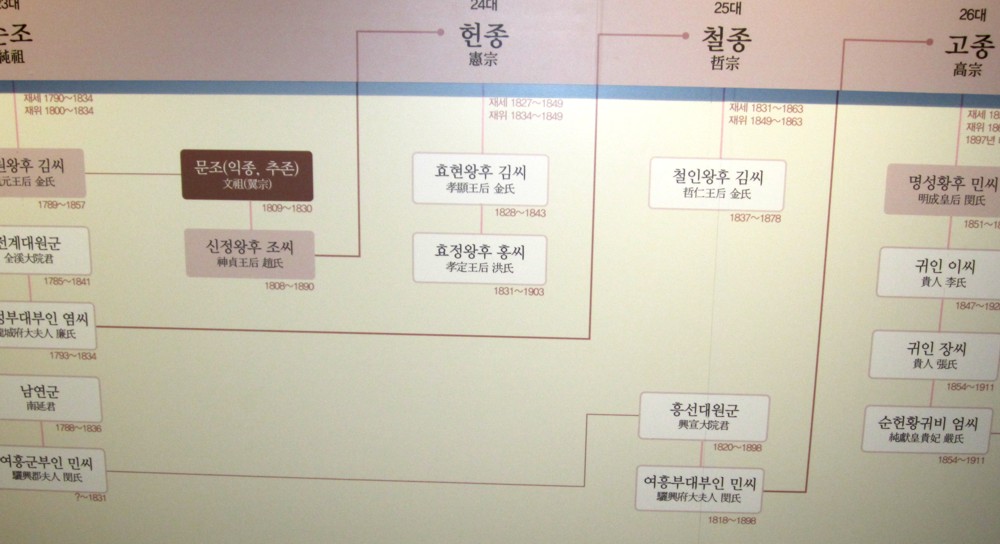
For example, we visited Gyeongbokgung, the Korean royal palace from the 14th Century, in Seoul. In the museum next to the palace grounds was a large wall chart in Korean, showing the Royal family tree up to 1910, when Japan annexed Korea and the royal family was dissolved. Look at this section (click for a larger image):
Korean Royal Family Tree 1790-1863
Unless you read Korean script, at first glance this will appear almost unintelligible. But with a little deduction, there is actually a lot of information which may be gleaned from the chart.
Click the photo above for a larger image. Each box has a pair of dates under it, noting the years of birth and death of that person. What can you learn about the Korean royal family in the 19th Century? The detail that is available to us using quite elementary math is surprising.
The study of history gives an excellent opportunity to put to use mathematics skills to learn more about the people being studied. Here are just a few pieces of information deduced merely from the dates provided and the graphical layout of the information:
Looking down the left-hand vertical column, birth dates are 1790 (the King), 1789, 1785, 1793, 1788. These people were thus of the same generation, since their birth dates were only a few years apart.
The six people in the left-hand column are in pairs, and each pair is linked by a line to an individual in a column to the right – obviously a couple’s child.
The person represented by the dark brown box was born when his parents were 19 and 20 years old, married someone approximately a year older, and they had a child when they were 18 and 19 years old.
The child became the 24th king at age 7, and reigned until the age of 22. In fact, the throne had skipped a generation, and the 24th king took the throne in the place of his grandfather, his father having already passed away 4 years earlier. His mother, on the other hand, outlived the king by 41 years. His grandmother also outlived him, and was 45 years old when he took the throne.
I wrote previously about using math in a visit to a graveyard to learn about the history of the people interred there. It is quite amazing how much one can learn using math in a similar context, even when the rest of the text is in a foreign language!
If you would like to use other photos from this museum to give students an experience of finding information using math, download the accompanying zip file containing 5 photos:
How do you use math in history classes? Feel free to leave a comment below.