Using Math to Make Sense of History in Korea

This week, my wife and I are in South Korea to visit family.

I have noticed when visiting museums that I am often able to use math to make sense of information that is presented in Korean, a language I don’t speak.

For example, we visited Gyeongbokgung, the Korean royal palace from the 14th Century, in Seoul. In the museum next to the palace grounds was a large wall chart in Korean, showing the Royal family tree up to 1910, when Japan annexed Korea and the royal family was dissolved. Look at this section (click for a larger image):

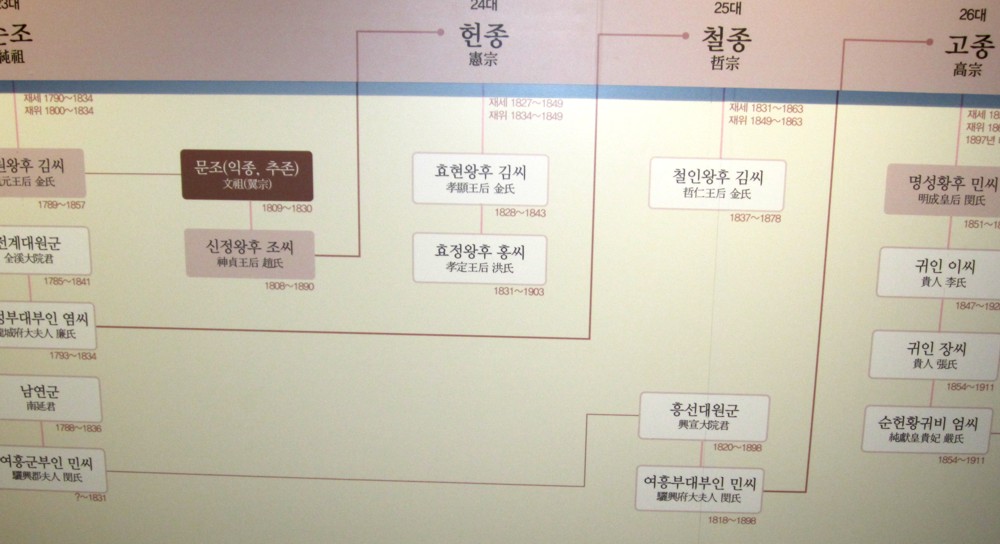
Korean Royal Family Tree 1790-1863

Unless you read Korean script, at first glance this will appear almost unintelligible. But with a little deduction, there is actually a lot of information which may be gleaned from the chart.

Click the photo above for a larger image. Each box has a pair of dates under it, noting the years of birth and death of that person. What can you learn about the Korean royal family in the 19th Century? The detail that is available to us using quite elementary math is surprising.

The study of history gives an excellent opportunity to put to use mathematics skills to learn more about the people being studied. Here are just a few pieces of information deduced merely from the dates provided and the graphical layout of the information:

  1. Looking down the left-hand vertical column, birth dates are 1790 (the King), 1789, 1785, 1793, 1788. These people were thus of the same generation, since their birth dates were only a few years apart.
  2. The six people in the left-hand column are in pairs, and each pair is linked by a line to an individual in a column to the right – obviously a couple’s child.
  3. The person represented by the dark brown box was born when his parents were 19 and 20 years old, married someone approximately a year older, and they had a child when they were 18 and 19 years old.
  4. The child became the 24th king at age 7, and reigned until the age of 22. In fact, the throne had skipped a generation, and the 24th king took the throne in the place of his grandfather, his father having already passed away 4 years earlier. His mother, on the other hand, outlived the king by 41 years. His grandmother also outlived him, and was 45 years old when he took the throne.

I wrote previously about using math in a visit to a graveyard to learn about the history of the people interred there. It is quite amazing how much one can learn using math in a similar context, even when the rest of the text is in a foreign language!

If you would like to use other photos from this museum to give students an experience of finding information using math, download the accompanying zip file containing 5 photos:

How do you use math in history classes? Feel free to leave a comment below.

Where is Zero on the Earth?

This is another in the series of podcasts from our trip in Europe.

Knowing exactly where you are on the earth’s surface is pretty important for most of us, and absolutely vital for airline pilots, surveyors, engineers and cartographers. Early study of location was difficult and inaccurate, hampered by lack of technology we now take for granted, and also by faulty understandings of the earth’s shape and location and movement in space.

I have long wanted to visit Greenwich, in London, to see the place which was designated as one of the ‘starting place’ for measurements on the earth’s surface, and also the reference point for time zones.

Google Map

This map shows the location of the video, and the Prime Meridian:

View Royal Observatory, Greenwich, London, UK in a larger map

Royal Observatory, Greenwich

In 1884, Greenwich was chosen as the place for the ‘Prime Meridian’, the official dividing line between the eastern and western hemispheres, the line of 0° longitude. Of course, the Equator is the equivalent line of 0° latitude, dividing the northern and southern hemispheres.

The Royal Observatory at Greenwich website includes this interesting snippet about the history of the Prime Meridian:

The Greenwich Meridian was chosen as the Prime Meridian of the World in 1884. Forty-one delegates from 25 nations met in Washington DC for the International Meridian Conference. By the end of the conference, Greenwich had won the prize of Longitude 0º by a vote of 22 to 1 against (San Domingo), with 2 abstentions (France and Brazil).

The day we visited we had to drive to Scotland and didn’t have time to go into the observatory. If you have time when you visit London, I recommend a visit to this iconic location on our planet.

Math in the Cemetery

How can you use a field trip to a cemetery to teach mathematics?

I visited Richmond Park in London with my brother, and while there visited the East Sheen Cemetery to film a podcast.

What can  you learn in a cemetery? At first glance, this may sound like a strange or even morbid suggestion. However, provided you don’t have an issue with this (and neither do the parents of your students), there is a lot to be learned from the information a cemetery offers. In fact, the headstones or other locations where details of those who have passed are recorded form a statistical database of the community, potentially a very rich and fascinating record of the history of people who have lived in the area, and the events that have affected their lives.

Google Map

This map shows the location of the video. Zoom out to see its location in relation to the London city centre:

View East Sheen Cemetery in a larger map

The cemetery I visited is in London, which has had a number of critical events in its history that might be reflected in the records at a cemetery, such as:

  • The Great Plague (1665 to 1666; killed 60,000 people)
  • The Great Fire of London (1666; killed 16)
  • World War I (1914-1918)
  • World War II & the Blitz (1939-1945; 30,000 killed)
  • Great Smog of London (1952; 4,000 died)

[Wikipedia: History of London]

Your local cemetery will, of course, reflect the history of your local area. This opens up lots of opportunities for studies in social studies, history, civic studies, geography, and math. In fact, mathematics can be put to good use to serve studies in other disciplines, by providing tools and methods to collate and analyse the data that is collected.

As a starting point, you could ask students to record the following data from grave records for later study in the classroom:

  • date of birth
  • date of death
  • gender
  • occupation
  • cause of death, if stated
  • relationship to others buried nearby
  • other interesting information

Footnote

By the way, this week I have made a few changes to the site, including removing a lot of fiddly looking links and graphics from the side menu and changing the colour scheme.
The biggest change, however, is that I have canned the audio podcast. The videos will continue, but the number of downloads of the audio was much lower, and so I’ve decided to simplify my life a bit and just produce one version of the podcast. The audio track is available from this page, if you’d like it, but it’s not part of the podcast feed for subscribers. Please let me know what you think!

Teach Roman Math

Teach your students about Roman civilization with a math connection!

I visited Chester in North England, where my brother lives with his family (he appears briefly in the video with his wife, and my wife and I). Chester is a fascinating town, which stands on top of Roman ruins, many of which no doubt have not yet been found. Basically, whenever a new building project gets underway, archaeologists have to be called in if (or more likely when) ruins are found on the site.

The video includes two on location shoots in Chester, the first at the town’s impressive Roman Amphitheatre, the biggest in Britain; and the second on the City Wall, built by the Romans, which is still largely complete and is a lovely walk around the city.

Math and the Romans

The Roman civilization was incredibly advanced for its time, in just about any field you can name (except perhaps moral behavior): architecture, engineering, military technology and leadership, government, art and fashion, economics, and so on. In many of these fields, mathematics would have been an essential part, just as they are today.

I suggest two straightforward “Roman Math” topics you can use in the primary or middle school classroom:

  • Numeration – study Roman numerals, compare and convert with our base ten system
  • Geometry – study tessellations and mosaics

With older classes and classes in Europe, other topics will be possible in the curriculum, and so if you are alert to the possibilities, you can link them to mathematics also.

Google Map

The map below shows the locations of the video shoot:

View Chester, England, UK in a larger map

How do you include math in your teaching of history, and ancient civilizations in particular? What other connections do you make with your students with the Romans, Egyptians, Mayans, and so on?